

Transparency International – Defence & Security created the following data visualisations to accompany the DCI 2020. This includes two infographics to show the overall results – one by region and one for all companies – as well as six individual infographics for each region captured in the analysis.
OVERALL RESULTS – GLOBAL TOTALS
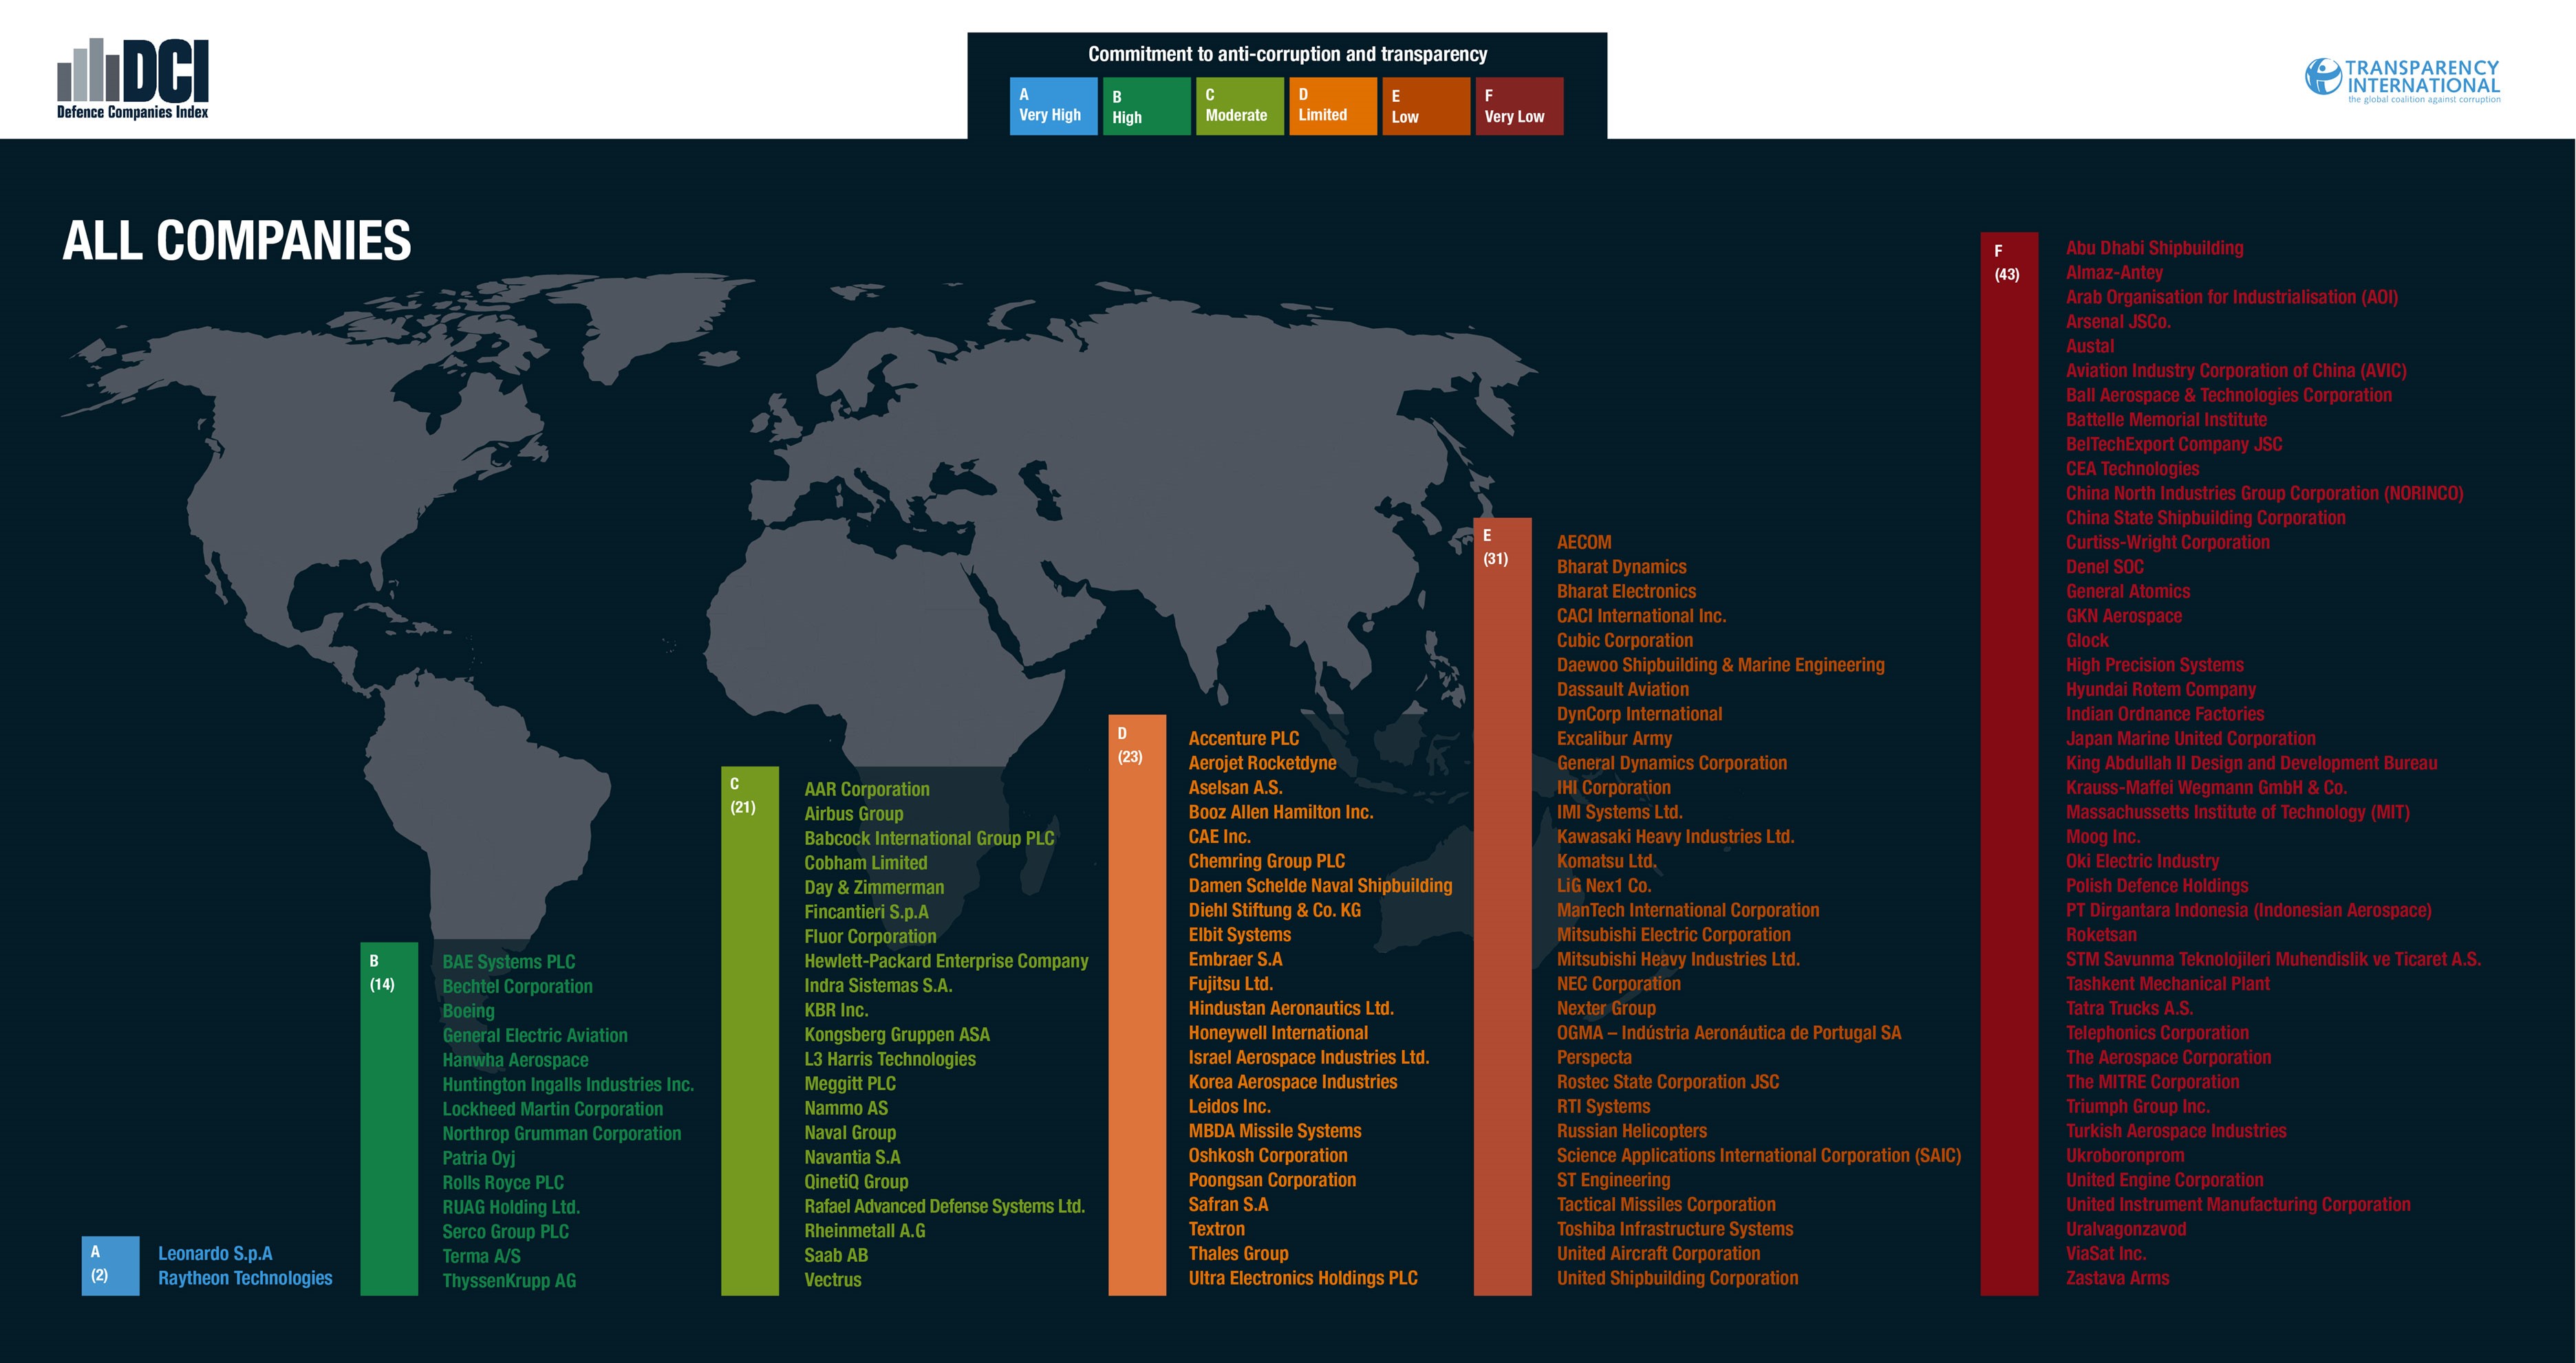
Click here to view full screen.
OVERALL RESULTS – BY REGION
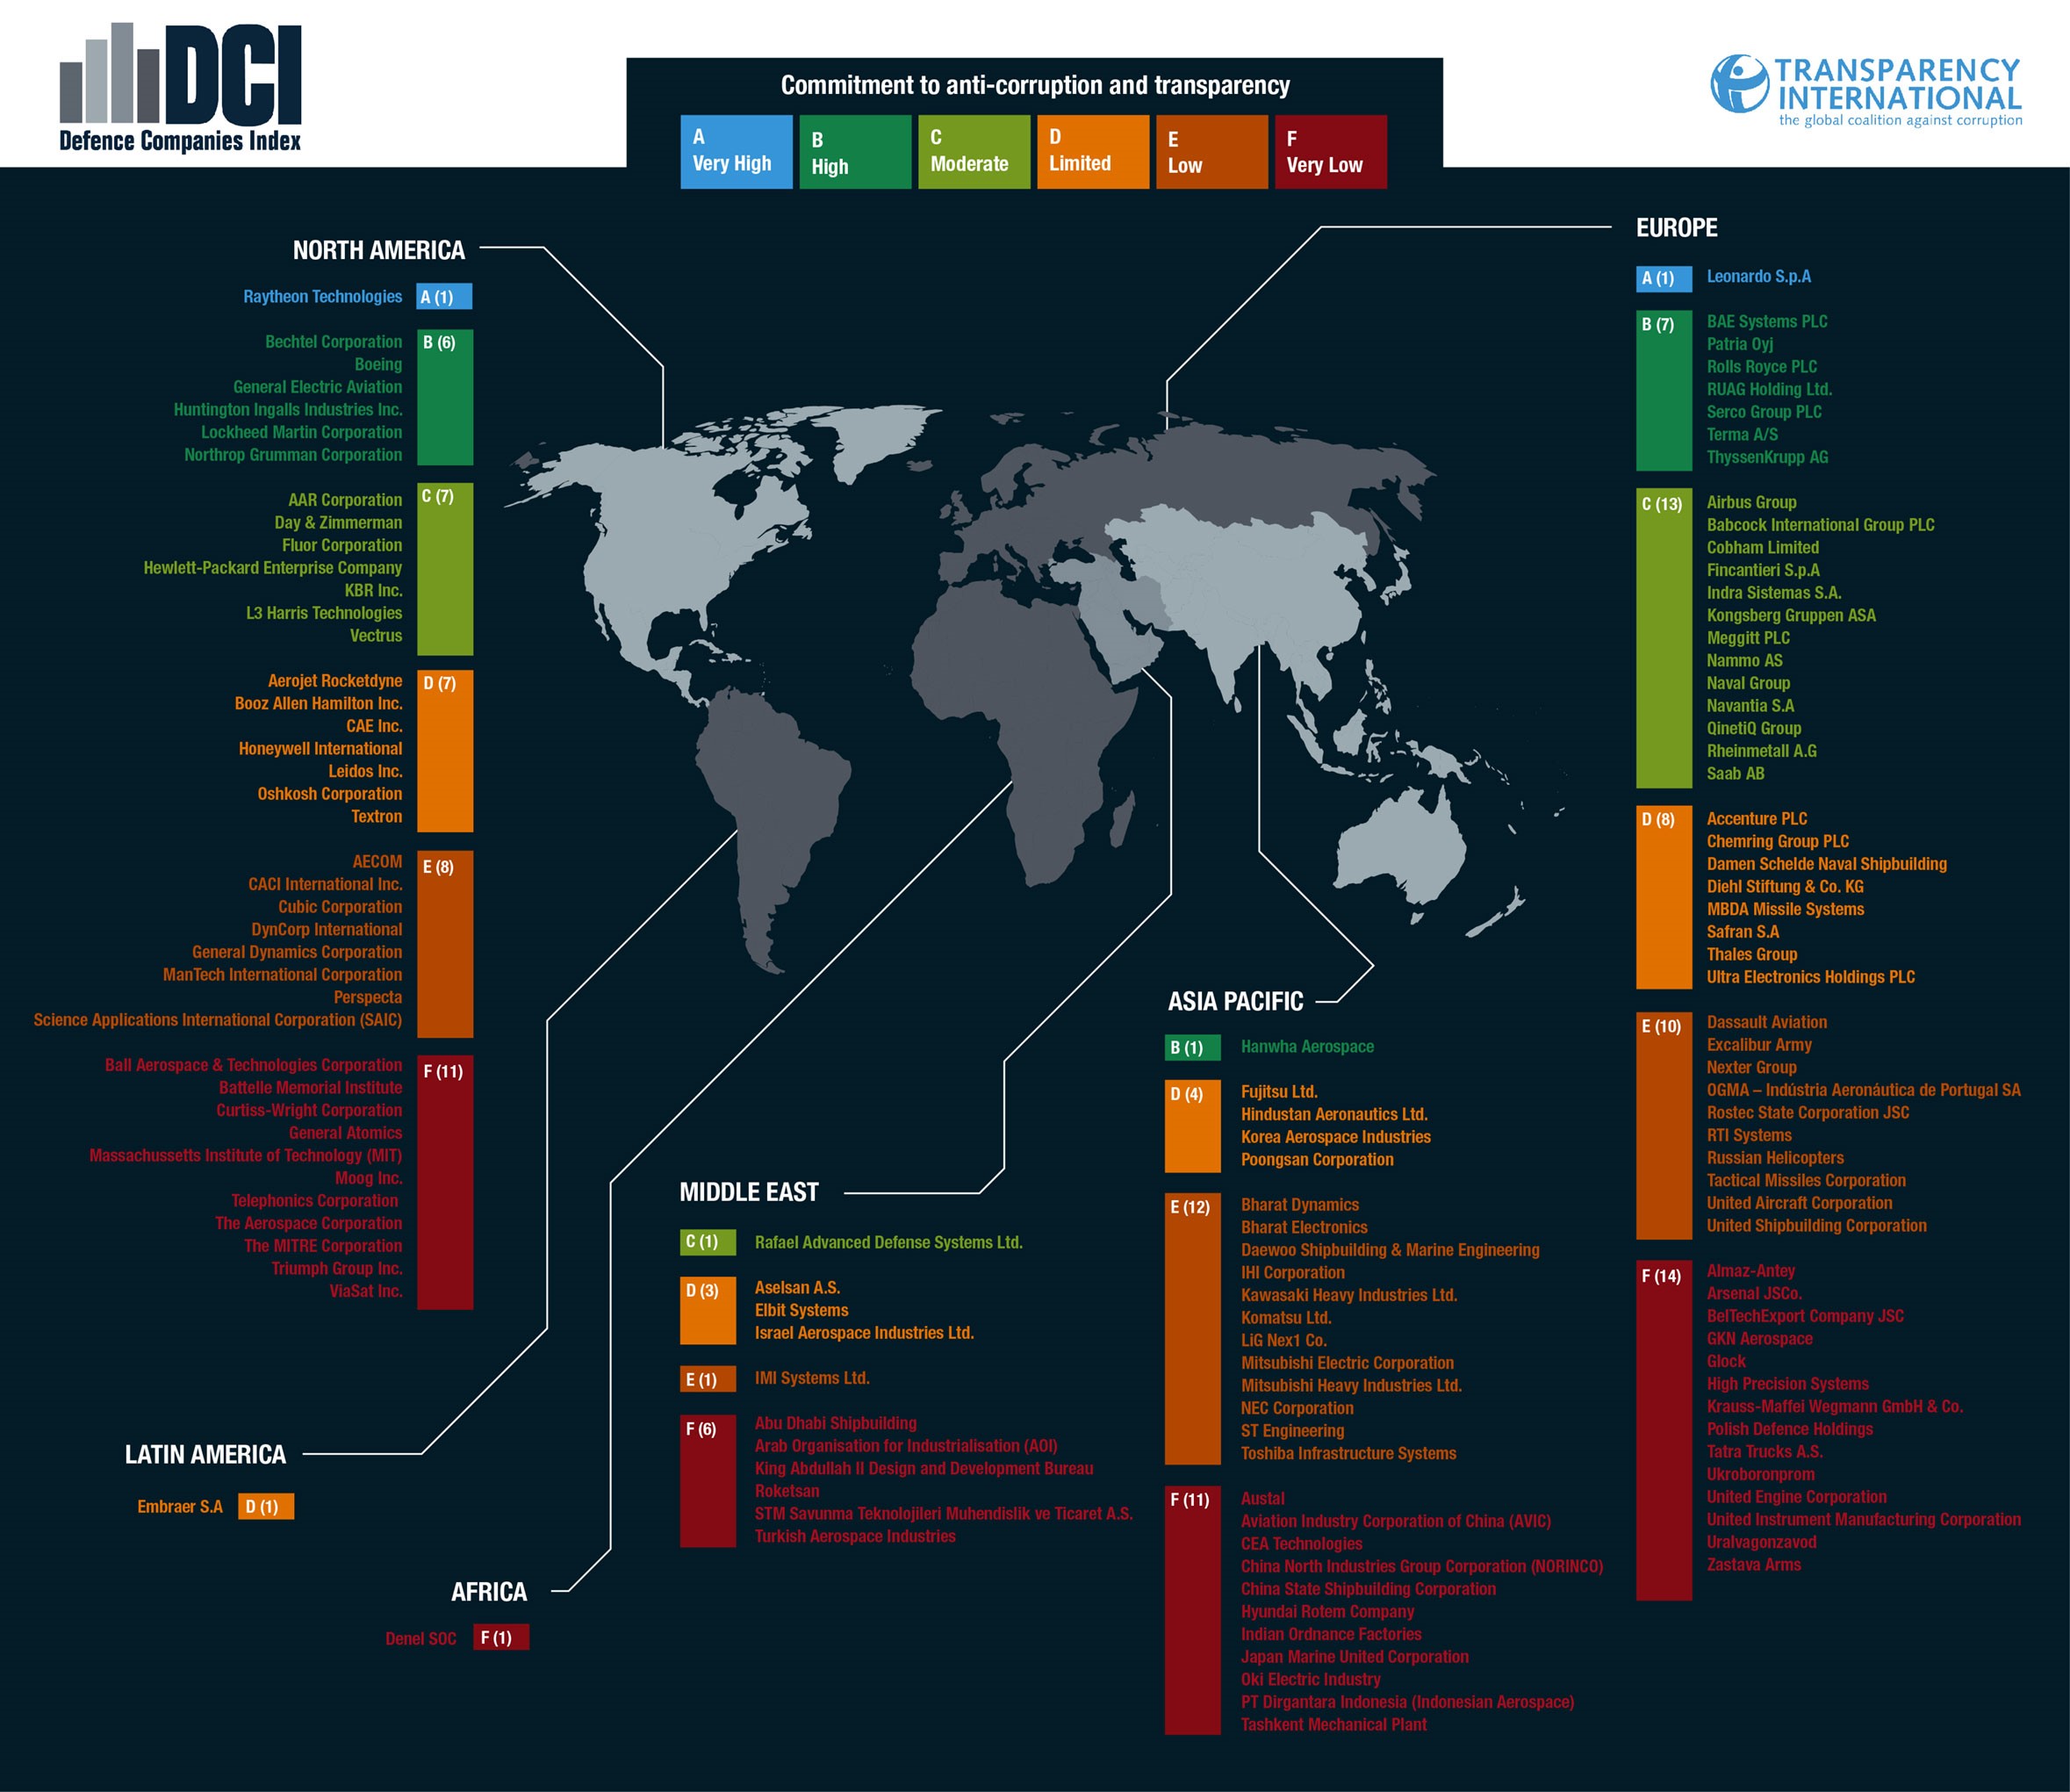
Click here to view full screen.
REGIONAL RESULTS – AFRICA

Click here to view full screen.
REGIONAL RESULTS – ASIA PACIFIC
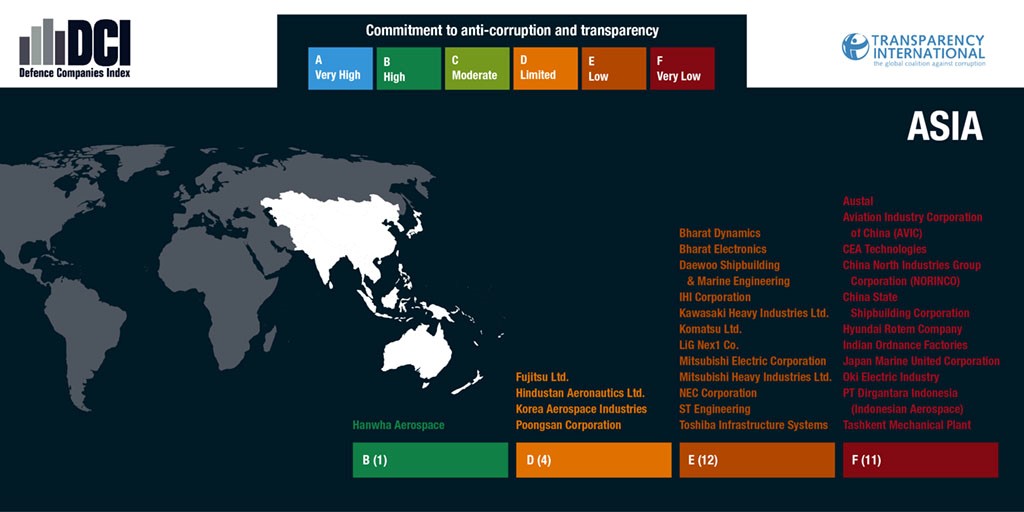
Click here to view full screen.
REGIONAL RESULTS – EUROPE
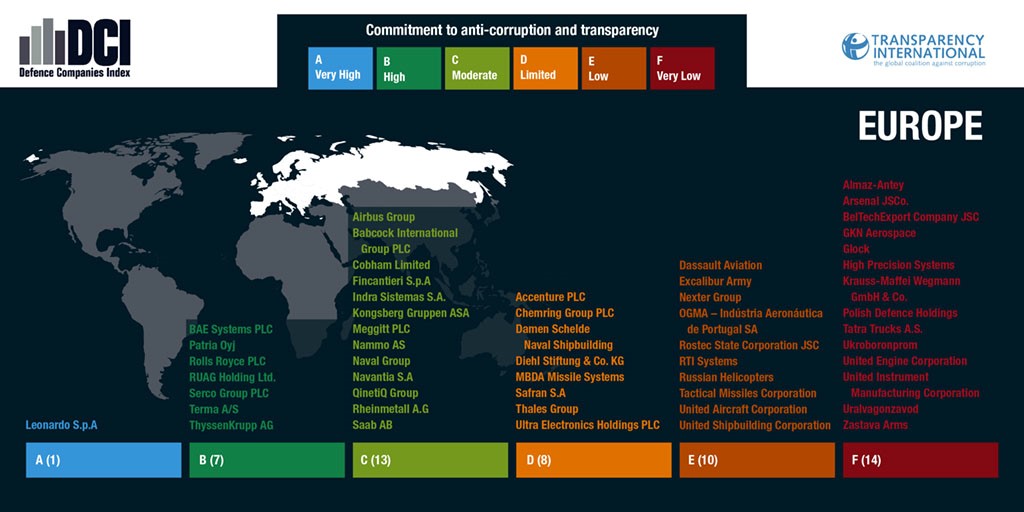
Click here to view full screen.
REGIONAL RESULTS – LATIN AMERICA
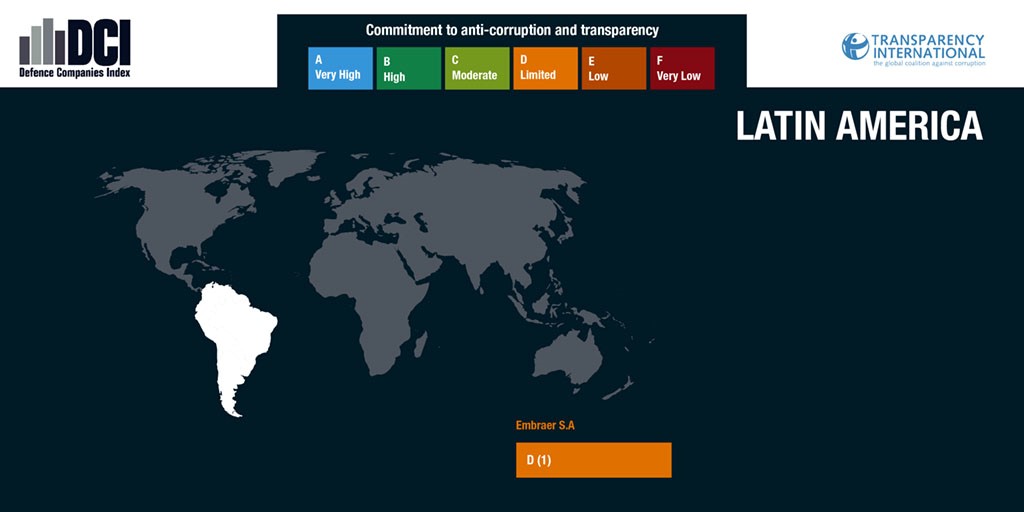
Click here to view full screen.
REGIONAL RESULTS – MIDDLE EAST
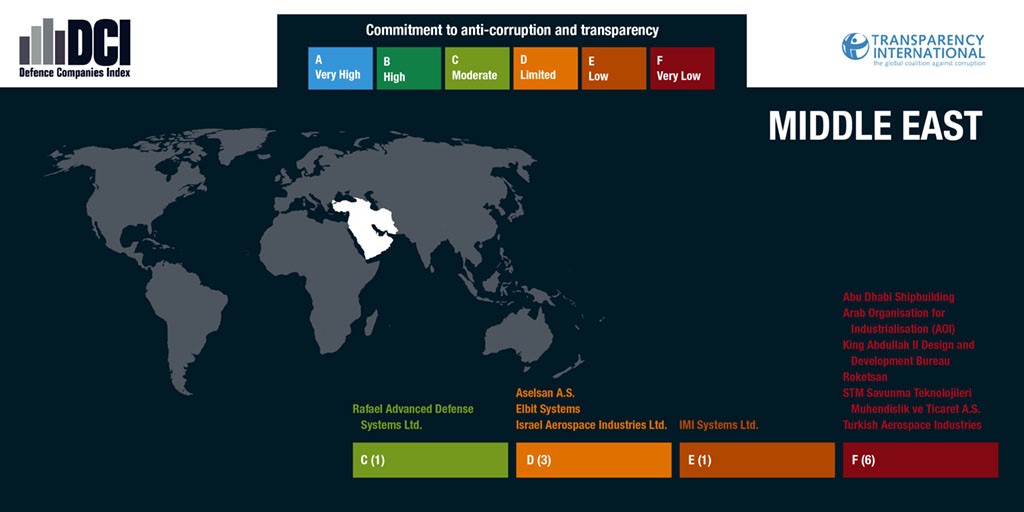
Click here to view full screen.
REGIONAL RESULTS – NORTH AMERICA
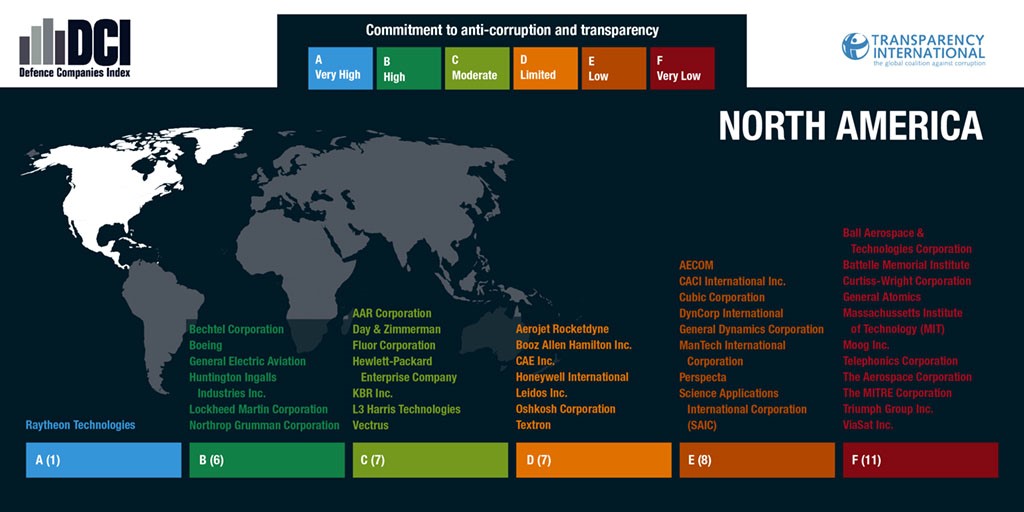
Click here to view full screen.